
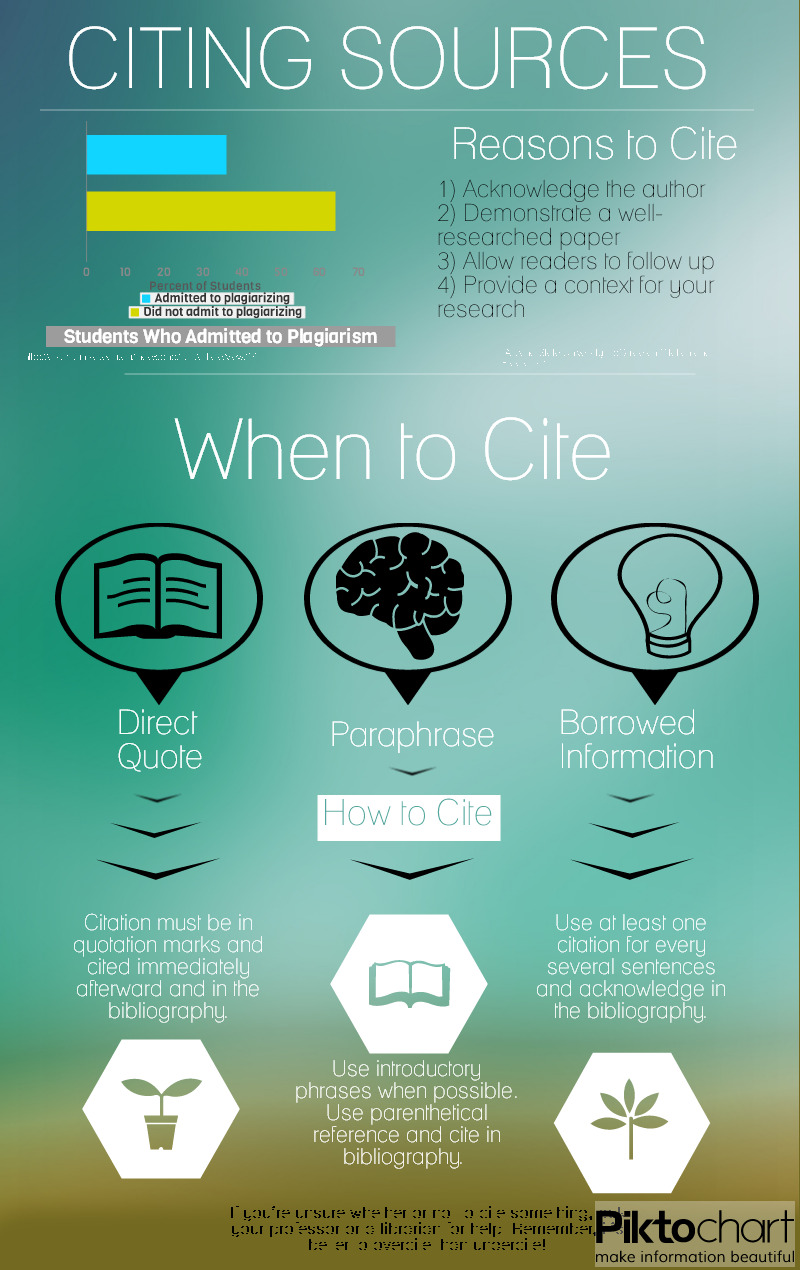
Below you will see my very first attempt at an infographic. It’s certainly not perfect, but I thought I’d share! It turns out that making infographics with Piktochart makes it easy to add and manipulate a whole array of ascetically pleasing elements, which is especially nice for those of us who are less artistic (i.e. me)–I would highly recommend it! If you know of any examples of good library-related infographics, feel free to post them below!

Hi! This is a great infographic, may I use it for a library libguide?
You certainly may! Thanks for checking! 🙂